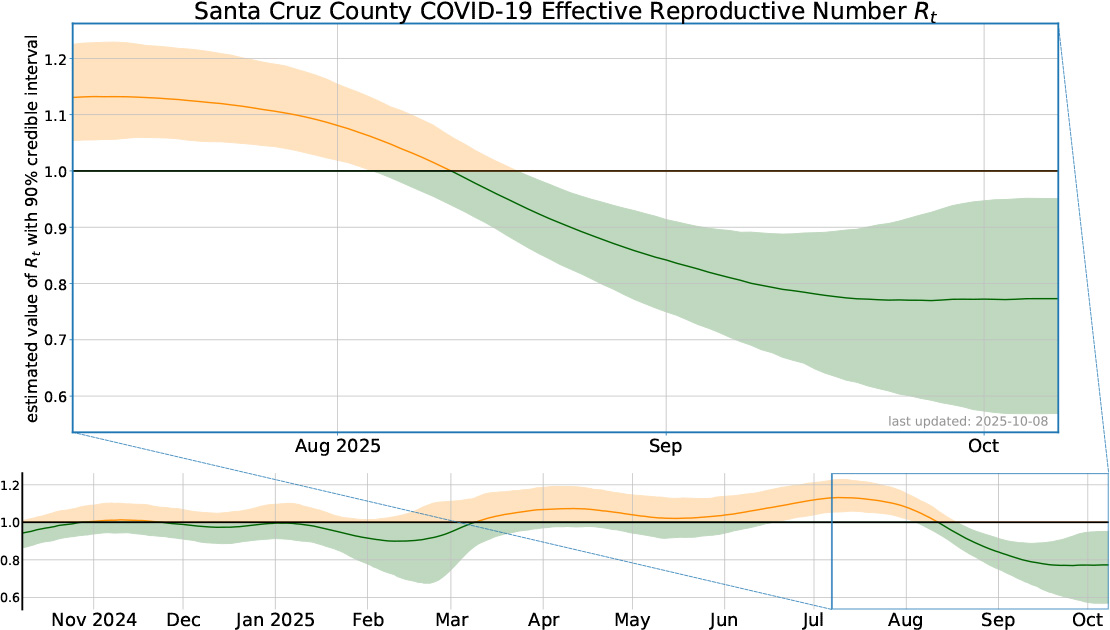
How to read the plot: The plot shows green (for good) when Rt is below 1 and COVID-19 spread is decreasing. When Rt is above 1 and COVID-19 spread is increasing, the plot is yellow (take caution). The darker line shows the most likely Rt in Santa Cruz county. Since models are not perfect, the shaded areas around the darker line show the range of likely Rt values. Please note that case data from the last 7 days are frequently updated and are excluded from the estimation of Rt.
Rt: COVID-19 Spread in Our Community
The Effective Reproductive Number, shown here as “Rt” helps us understand how fast COVID-19 is spreading in our community. For COVID-19, Rt tells us the average number of people who will contract this disease from each infected person.
For example, if Rt equals 1, each existing infection causes one new infection. An Rt equal to 1 means the disease will stay present and stable in our community.
If Rt is less than 1, each existing infection causes less than one new infection. Therefore, if Rt stays below 1, spread of the disease declines and it eventually leaves the community.
When Rt is more than 1, each existing COVID-19 infection causes more than one new infection. The disease will be transmitted between more and more people and the spread of the disease is growing. If Rt stays greater than 1, it can lead to many challenges, including hospitals not being able to care for everyone who gets sick.
Rt depends on people’s behavior, like wearing a mask or keeping social distance. This is why Rt can change over time.
Santa Cruz County COVID-19 Hospitalization Projections
For current information on hospital usage including ICU beds, please visit the California COVID-19 Hospital data page.
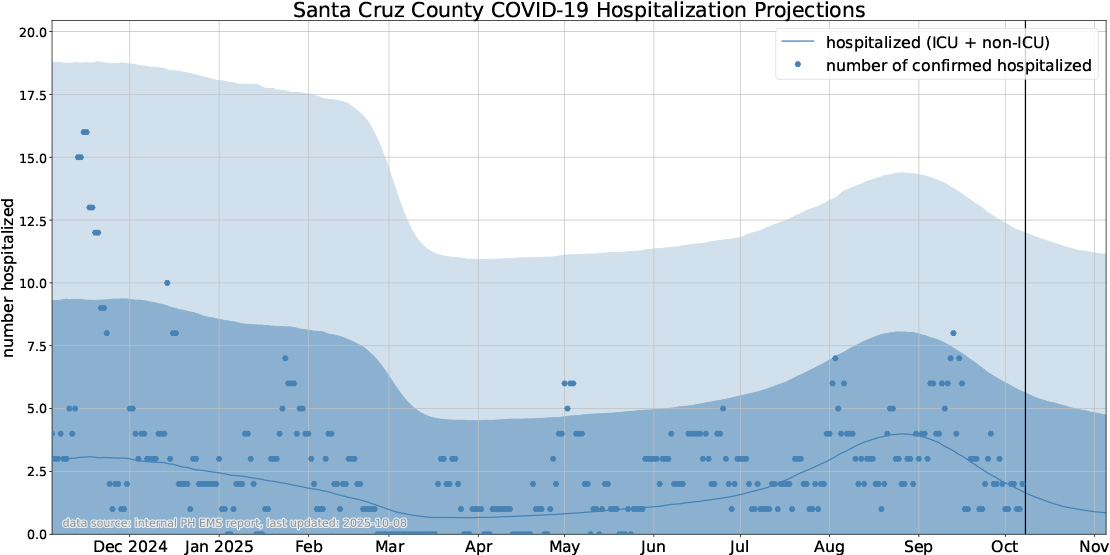
How to read the model: For the actual number of hospitalizations in the past, we use the blue dots. To look at the future, we use the dark blue line and the light blue area. The dark blue line is the most likely number of hospitalizations in the future. Since models are not perfect, the light blue wider area shows the range of likely hospitalizations.”
Why We Forecast Hospitalizations
We all rely on our hospitals to take care of us when we are very ill. If a hospital gets too full, it doesn’t have enough space or staff to care for everyone.
So, it is important to keep track of how many people are staying in a hospital at one time. It is also important to use our forecasts to predict when hospitals might get too full.
When our hospitals start to get too full, we need to take actions to slow the spread of COVID-19.
Tracking and forecasting how many people are in our hospitals help us SAVE Lives in our community.
Santa Cruz County COVID-19 Wastewater Projections
How to Read This Model
In order to help calculate the risk of getting a COVID-19 infection, we use this data to predict whether or not viral concentrations are increasing or decreasing.
The red/sienna dots correspond to the actual observed viral levels of COVID-19 detected in Santa Cruz City, Santa Cruz County and Watsonville wastewater collection sites in units of copies per liter with a population weighted average. WEighted averages were used to adjust for changes in population coverage at each wastewater collection sites. Learn more about wastewater by visiting the CDC's National Wastewater Surveillance System (NWSS) website.
Notice the date range on the x-axis (line on the bottom of the graph). The area to the right of the current date are predictions and there are no observations reported in that area. The dark red line is the most likely level of COVID-19 in the wastewater in the future. Since models are not perfect, the light red wider area shows the range of likely virus levels. And the darker shaded area is the more likely range.
The yellow line is based from CDC’s recommended moderate community level threshold, or new cases greater than or equal to 200 per 100,000 people per week. The wastewater level corresponding to CDC's case-based moderate risk threshold was created by linking past COVID-19 case counts with the concentration of SARS-CoV-2 genes in wastewater. Specifically, this level estimate is based on wastewater level-to-case ratios in Santa Cruz County from April to November 2022.
SARS-CoV-2 Sewage Monitoring Data
SARS-CoV-2 (the virus that causes COVID-19) is shed in feces by infected individuals and can be measured in wastewater. More cases of COVID-19 in the community are associated with increased levels of SARS-CoV-2 in wastewater, meaning that data from wastewater analysis can be used as an indicator of the level of transmission of COVID-19 in the community.
Wastewater analysis measures the levels of non-infectious RNA (Ribonucleic Acid) in wastewater, not the viable virus. There are no known cases of transmission resulting from exposure to wastewater.
Advantages of WBE
The use of WBE has several potential advantages:
It includes asymptomatic individuals and people who are unable or unwilling to obtain clinical tests, for a variety of reasons.
It provides a mechanism to monitor the level of community transmission as clinical testing declines, and other, more convenient testing takes place (such as home-based rapid antigen tests) that are not reported to the Public Health Department. Wastewater analysis continues to be a part of our ongoing strategy to monitor the level of community transmission.
Wastewater information is available sooner than information from clinical testing, which means that monitoring SARS-CoV-2 in wastewater can serve as an early indicator of increasing or decreasing COVID-19 infections in the community.
During an increase, this early information could be used to enhance public health messaging in the affected communities to reinforce safe practices, promote more clinical testing, and highlight strategies the public can take to help stop a surge in new cases.
It can help confirm current trends of COVID-19 infections in the community that are based on clinical data.
It can increase confidence that clinical testing results are not biased by availability, time lags, and other factors.
Why We Monitor and Forecast Wastewater Data
Monitoring the concentration of the SARS-CoV-2 (COVID-19) virus in wastewater is a new way to know how much virus is spreading in the community. Wastewater monitoring includes those who haven't been tested. The COVID-19 virus is shed in the feces of infected people, including those who aren't experiencing symptoms. According to scientific research (click HERE to read the research), the viral concentration of COVID-19 in wastewater is highly linked to an increase in cases. When viral concentrations in the wastewater are increasing, then the risk for acquiring a COVID-19 infection from another person is increased.